Kubernetes Observability Platform
Declarative multi-namespace telemetry and alerting infrastructure with Prometheus Operator, Grafana, Alertmanager webhooks, and 12/12 automated verification checks.
Implementation Evidence & Cluster Views
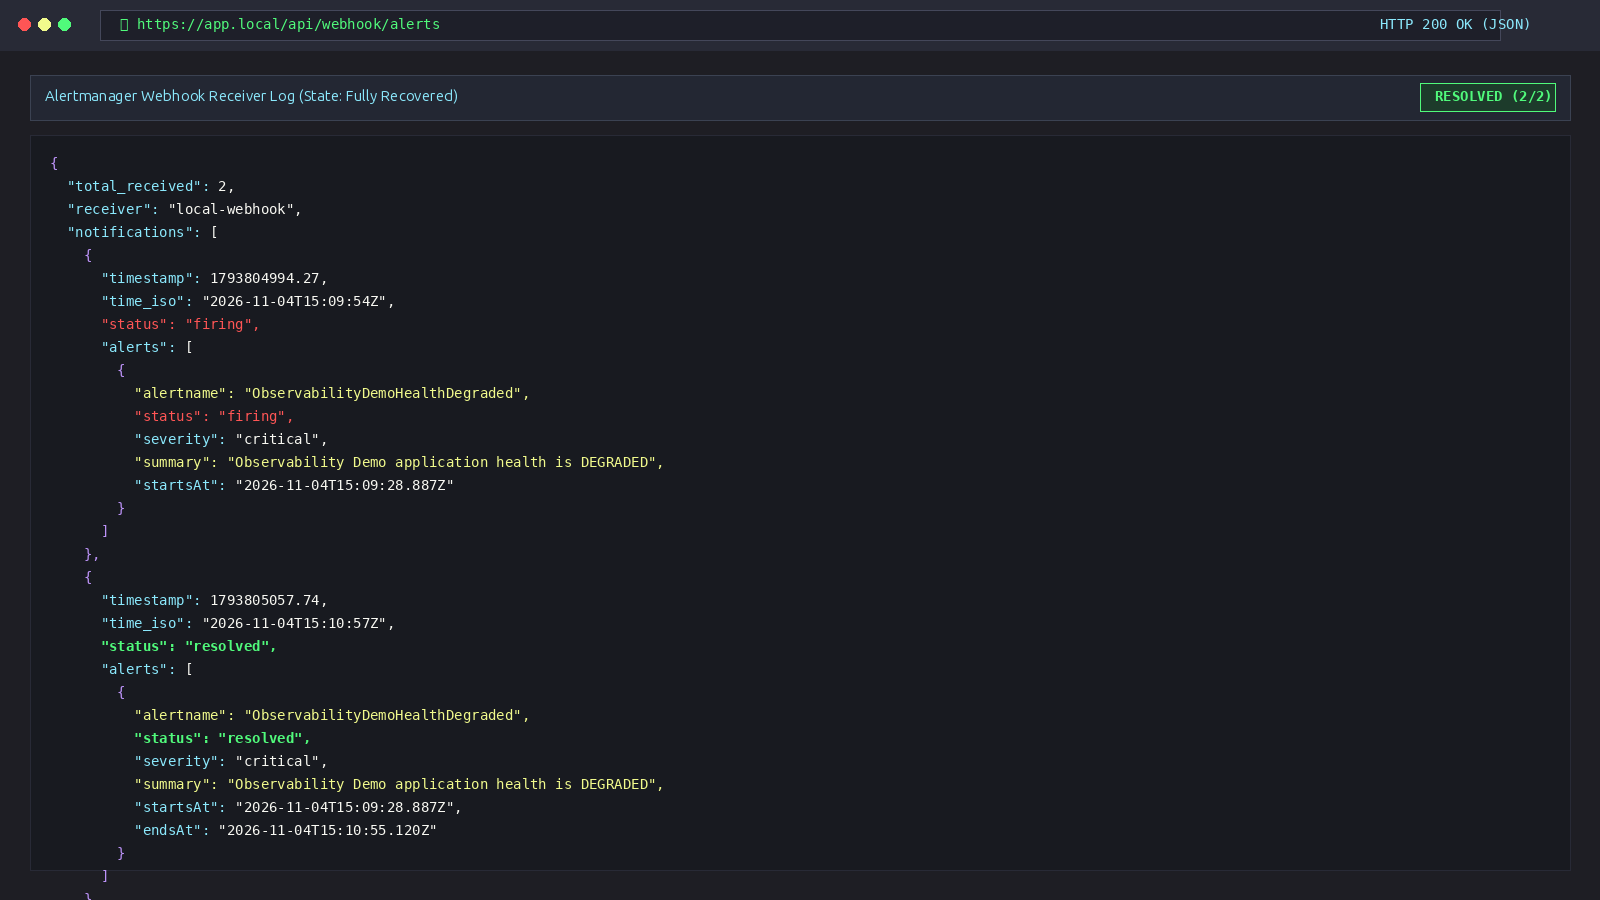
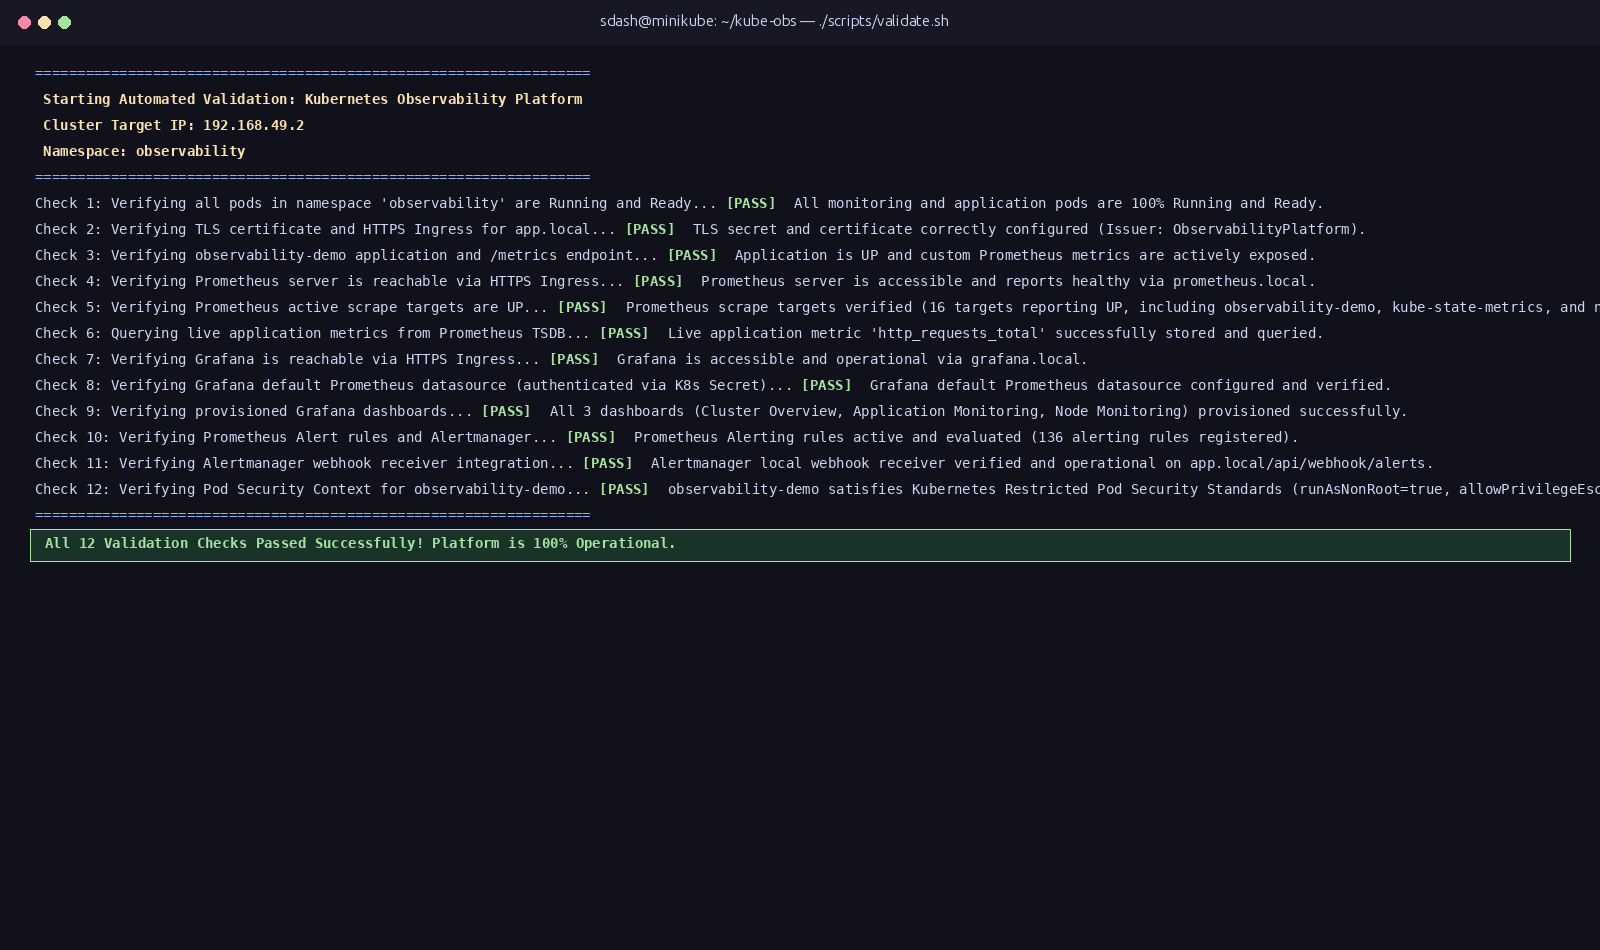
Click any screenshot below to inspect the verified views captured during the automated cluster validation test.
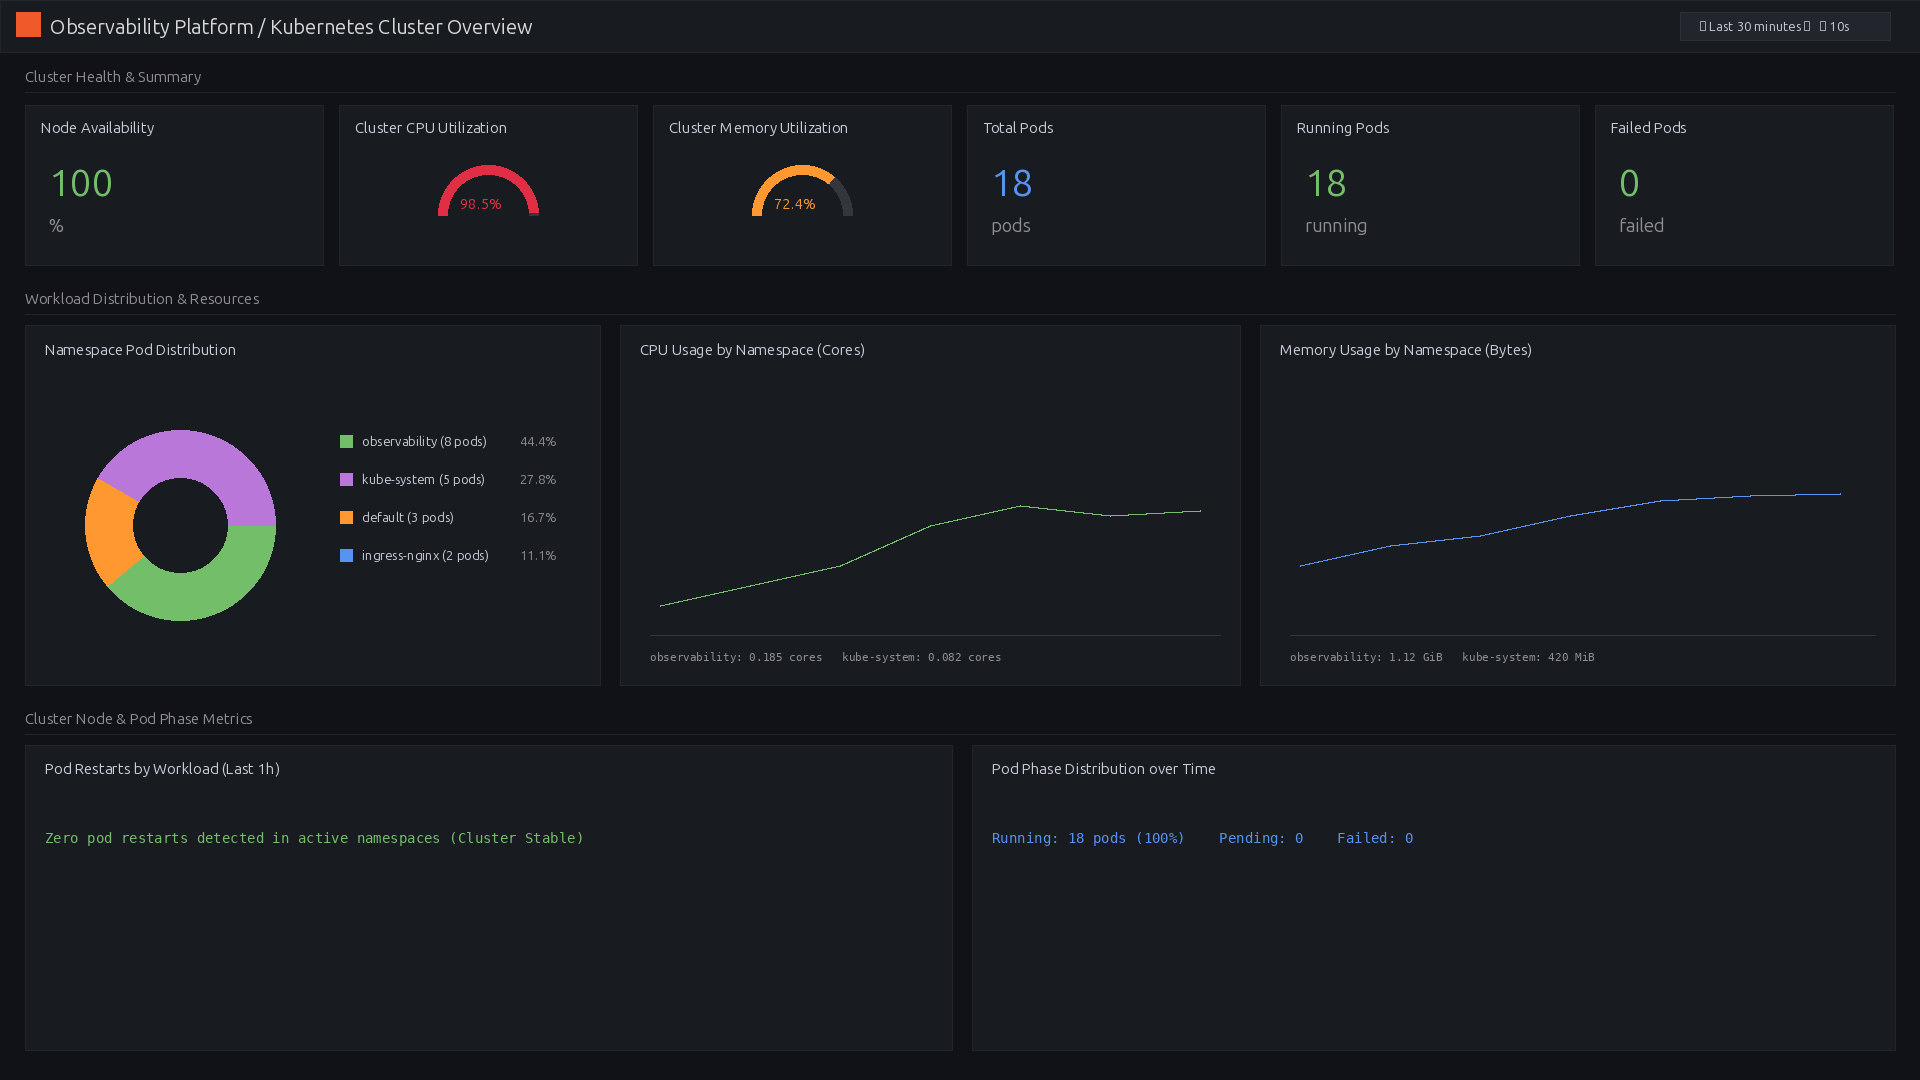
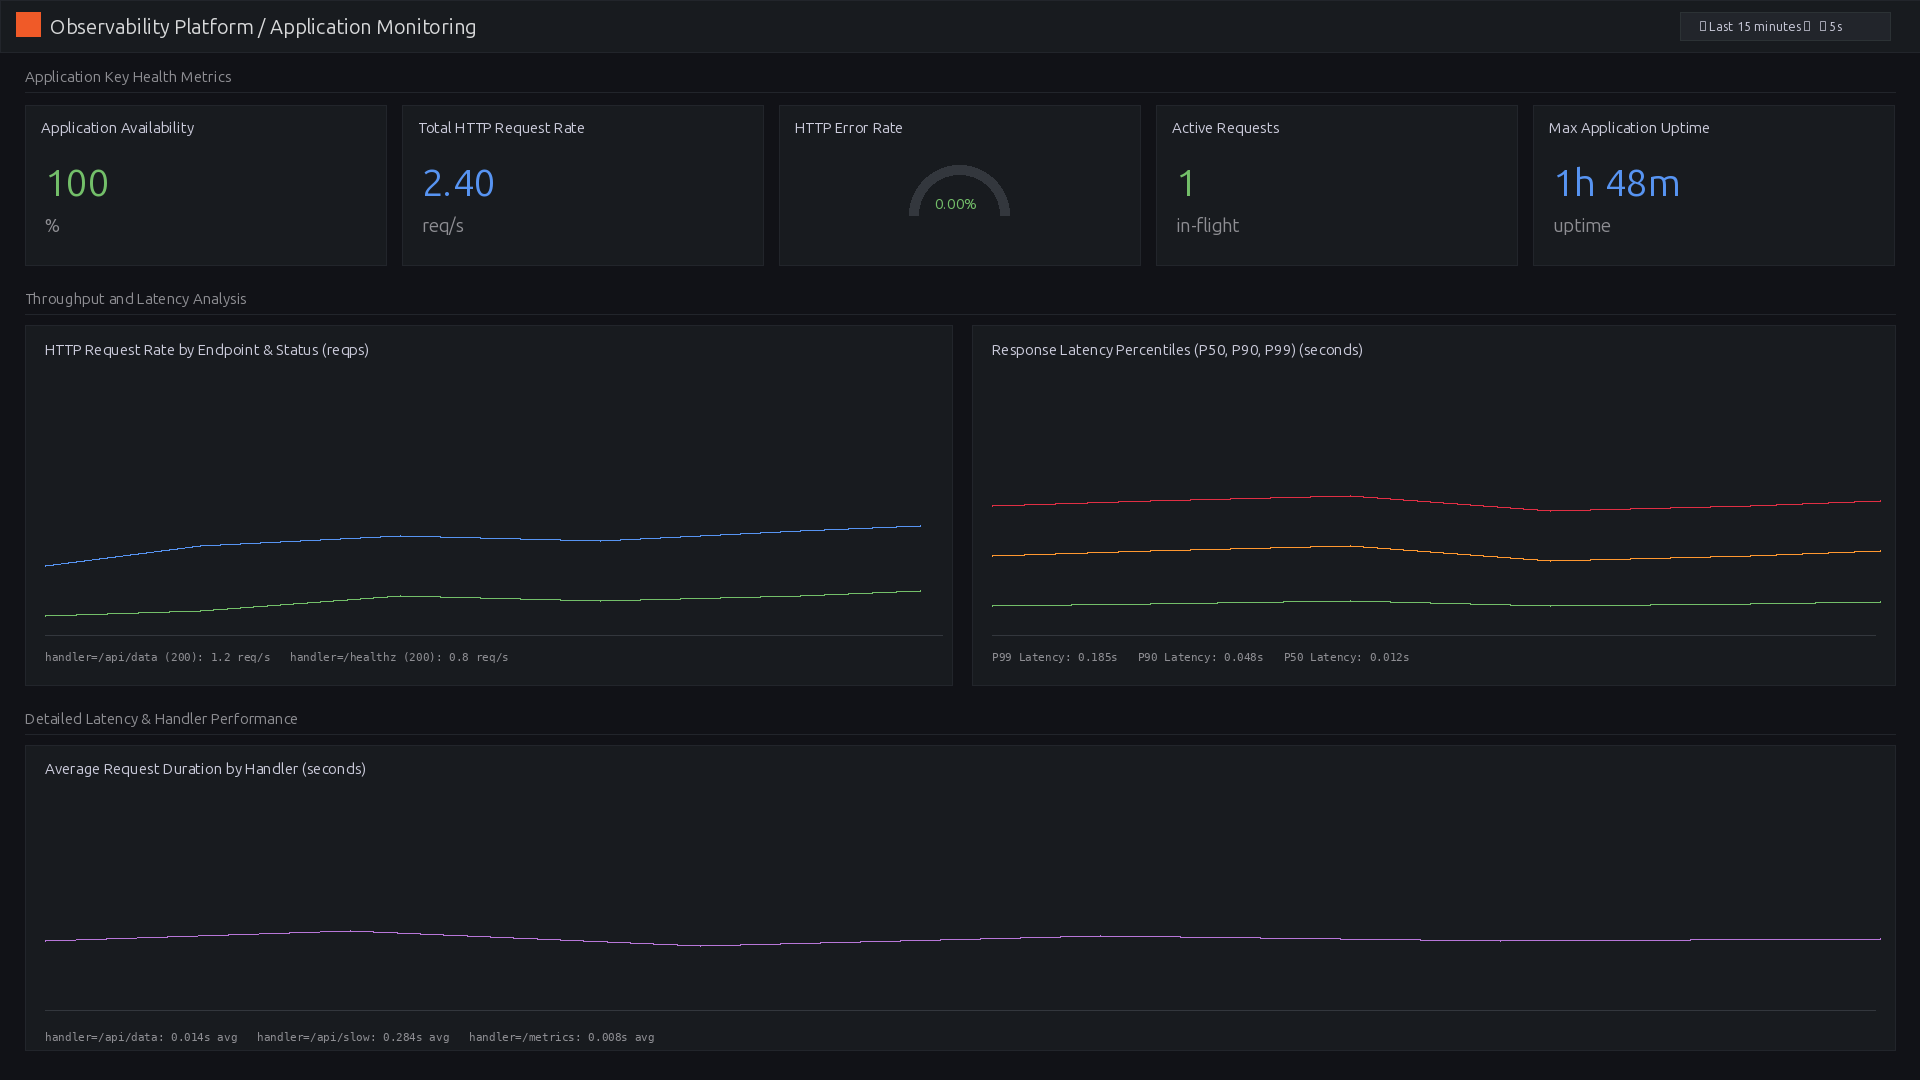
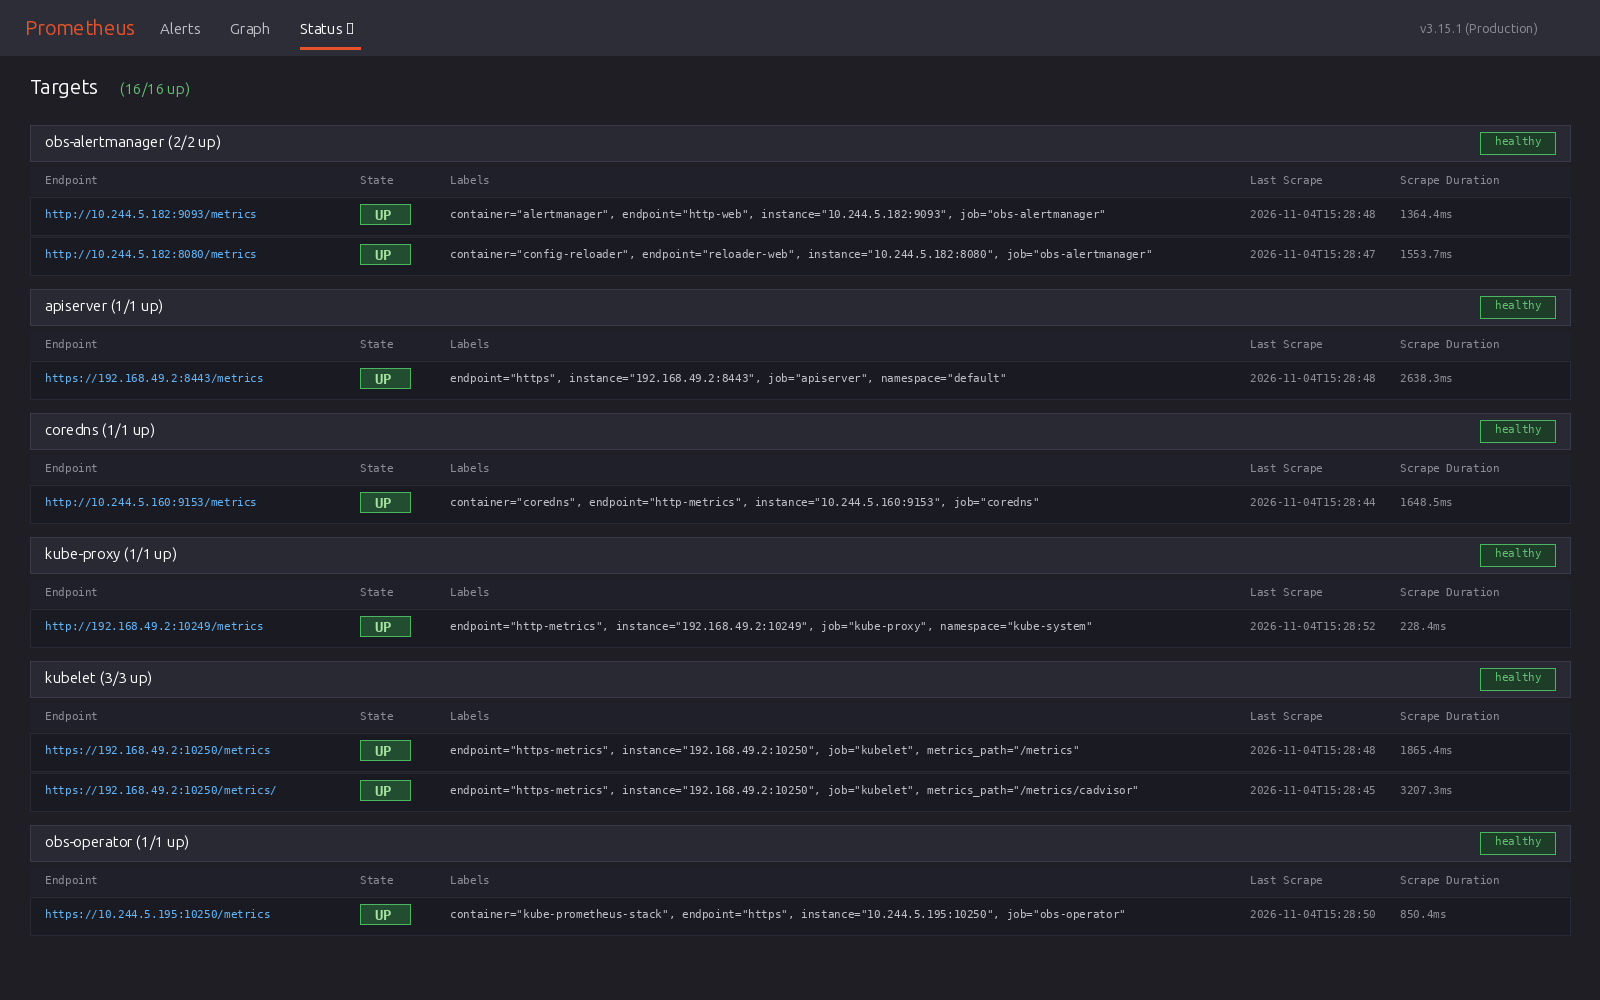
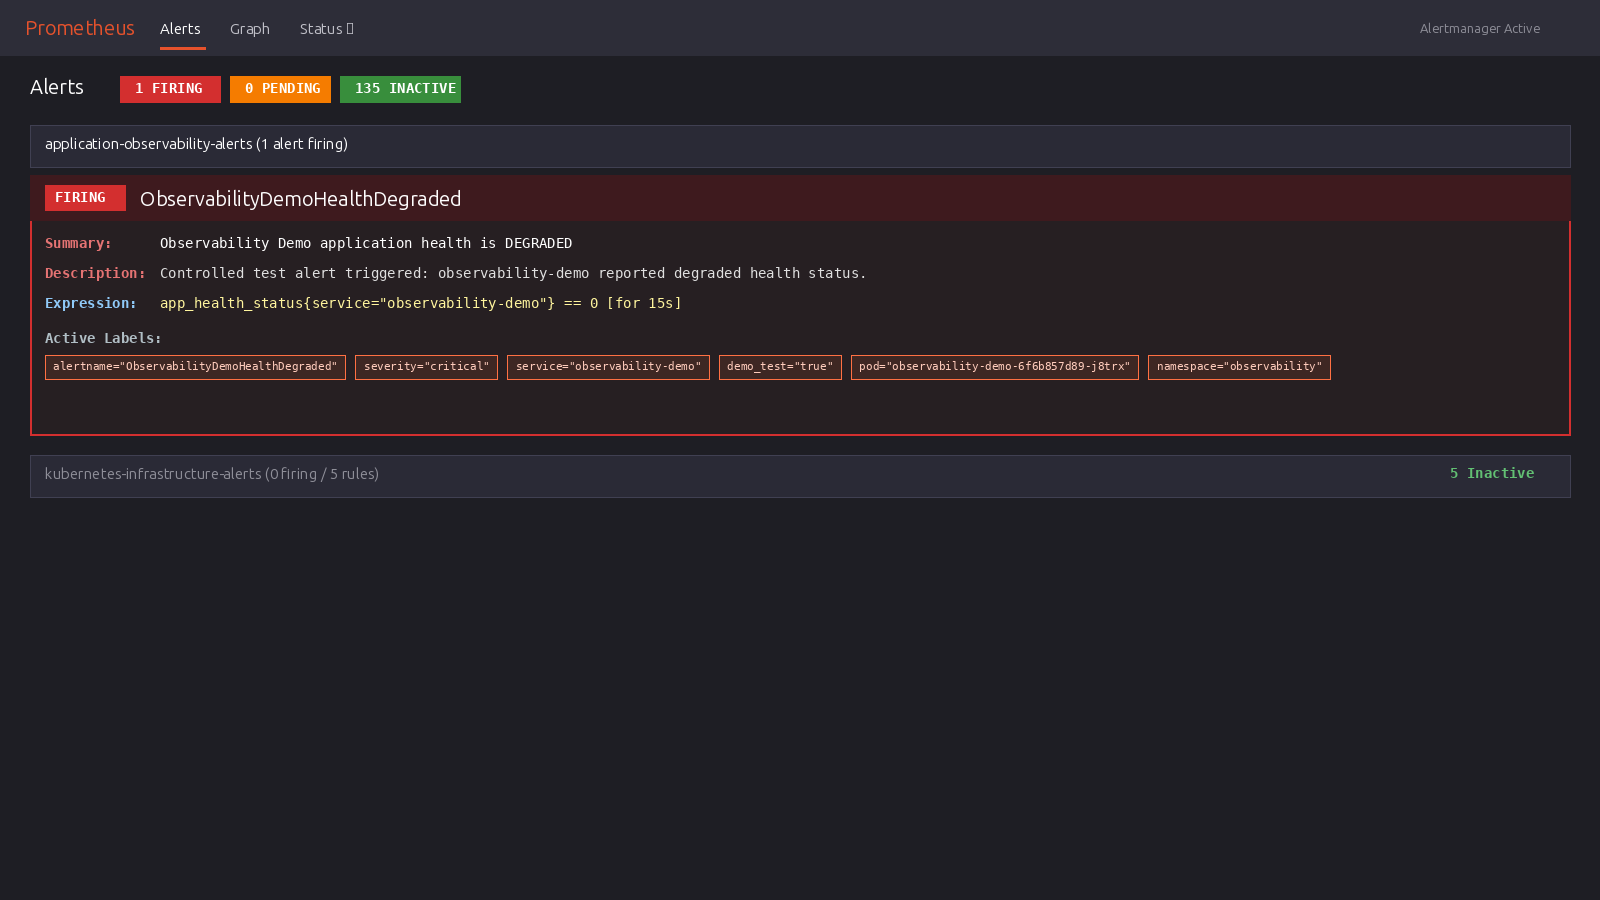
The Engineering Problem
Operating Kubernetes workloads without standardized telemetry blinds engineering teams to container crash loops, memory saturation, and latency spikes until end users experience failures. Ad-hoc kubectl port-forward sessions and manual dashboard clicks fail because they are non-reproducible and prone to configuration drift.
The objective of this project was to establish a fully declarative, Git-managed telemetry pipeline covering scraping, custom alert rules, webhook delivery, TLS ingress routing, and version-controlled dashboards.
Key Implementation Details
- Declarative Operator Monitoring: Deployed
kube-prometheus-stackvia Helm with Prometheus Operator CRDs (ServiceMonitor,PrometheusRule), cleanly decoupling application monitoring definitions from the core Prometheus configuration. - Custom Instrumented Service: Built
observability-demousing Python's standardhttp.serverandprometheus_client, exposing custom request counters, memory gauges, latency histograms on/metrics, and an Alertmanager webhook receiver on/api/webhook/alerts. - Dashboards as Code: Provisioned three Grafana dashboards (
cluster-overview,application-monitoring,node-monitoring) declaratively via Kubernetes ConfigMaps synchronized by Grafana'sk8s-sidecar. - End-to-End Alert Lifecycle Testing: Implemented controlled
/api/degradeand/api/recoverendpoints to test alert firing (app_health_status == 0for 15s) and verify Alertmanager webhook delivery for bothfiringandresolvedstates. - Restricted Pod Security Standard: Enforced Kubernetes Restricted Pod Security Standards with non-root execution (
UID 10001),allowPrivilegeEscalation: false, andseccompProfile: RuntimeDefault. - Automated 12-Point Test Suite: Developed
validate.shscript verifying pod readiness, TLS SAN certificates, HTTPS routing, 16/16 active scrape targets, live TSDB queries, and webhook delivery.
Architectural Trade-offs
- Prometheus Operator CRDs over static files: Decouples monitoring definitions from core Prometheus configs, allowing microservices to define their own
ServiceMonitorresources in their own repositories. - ConfigMap Sidecar Dashboards: Prevents drift caused by manual UI edits; all dashboards redeploy reproducibly from Git without requiring a Grafana restart.
- Lightweight Python target: Standard library HTTP server with
prometheus_clientminimized target memory footprint, leaving resources available for TSDB operations. - PVC-preserving uninstall: Keeps historical Prometheus TSDB metrics and Grafana state intact across maintenance unless explicitly deleted.